CLOUDWATCH CUSTOM METRICS FOR GO APPLICATIONS
JUN 20, 2025•12 MIN READ
Share:
After setting up S3 in our CI/CD pipeline, the next step is implementing proper monitoring. In this post, we'll explore AWS CloudWatch to monitor our Go application's health and performance. We'll focus on two key aspects:
- Custom metrics from our Go application (error tracking)
- System-level metrics (CPU, memory, network, disk)
Why CloudWatch? It provides:
- Centralized monitoring
- Custom metrics for application-specific data
- System-level metrics for infrastructure health
- Integration with other AWS services
Step-by-Step Guide
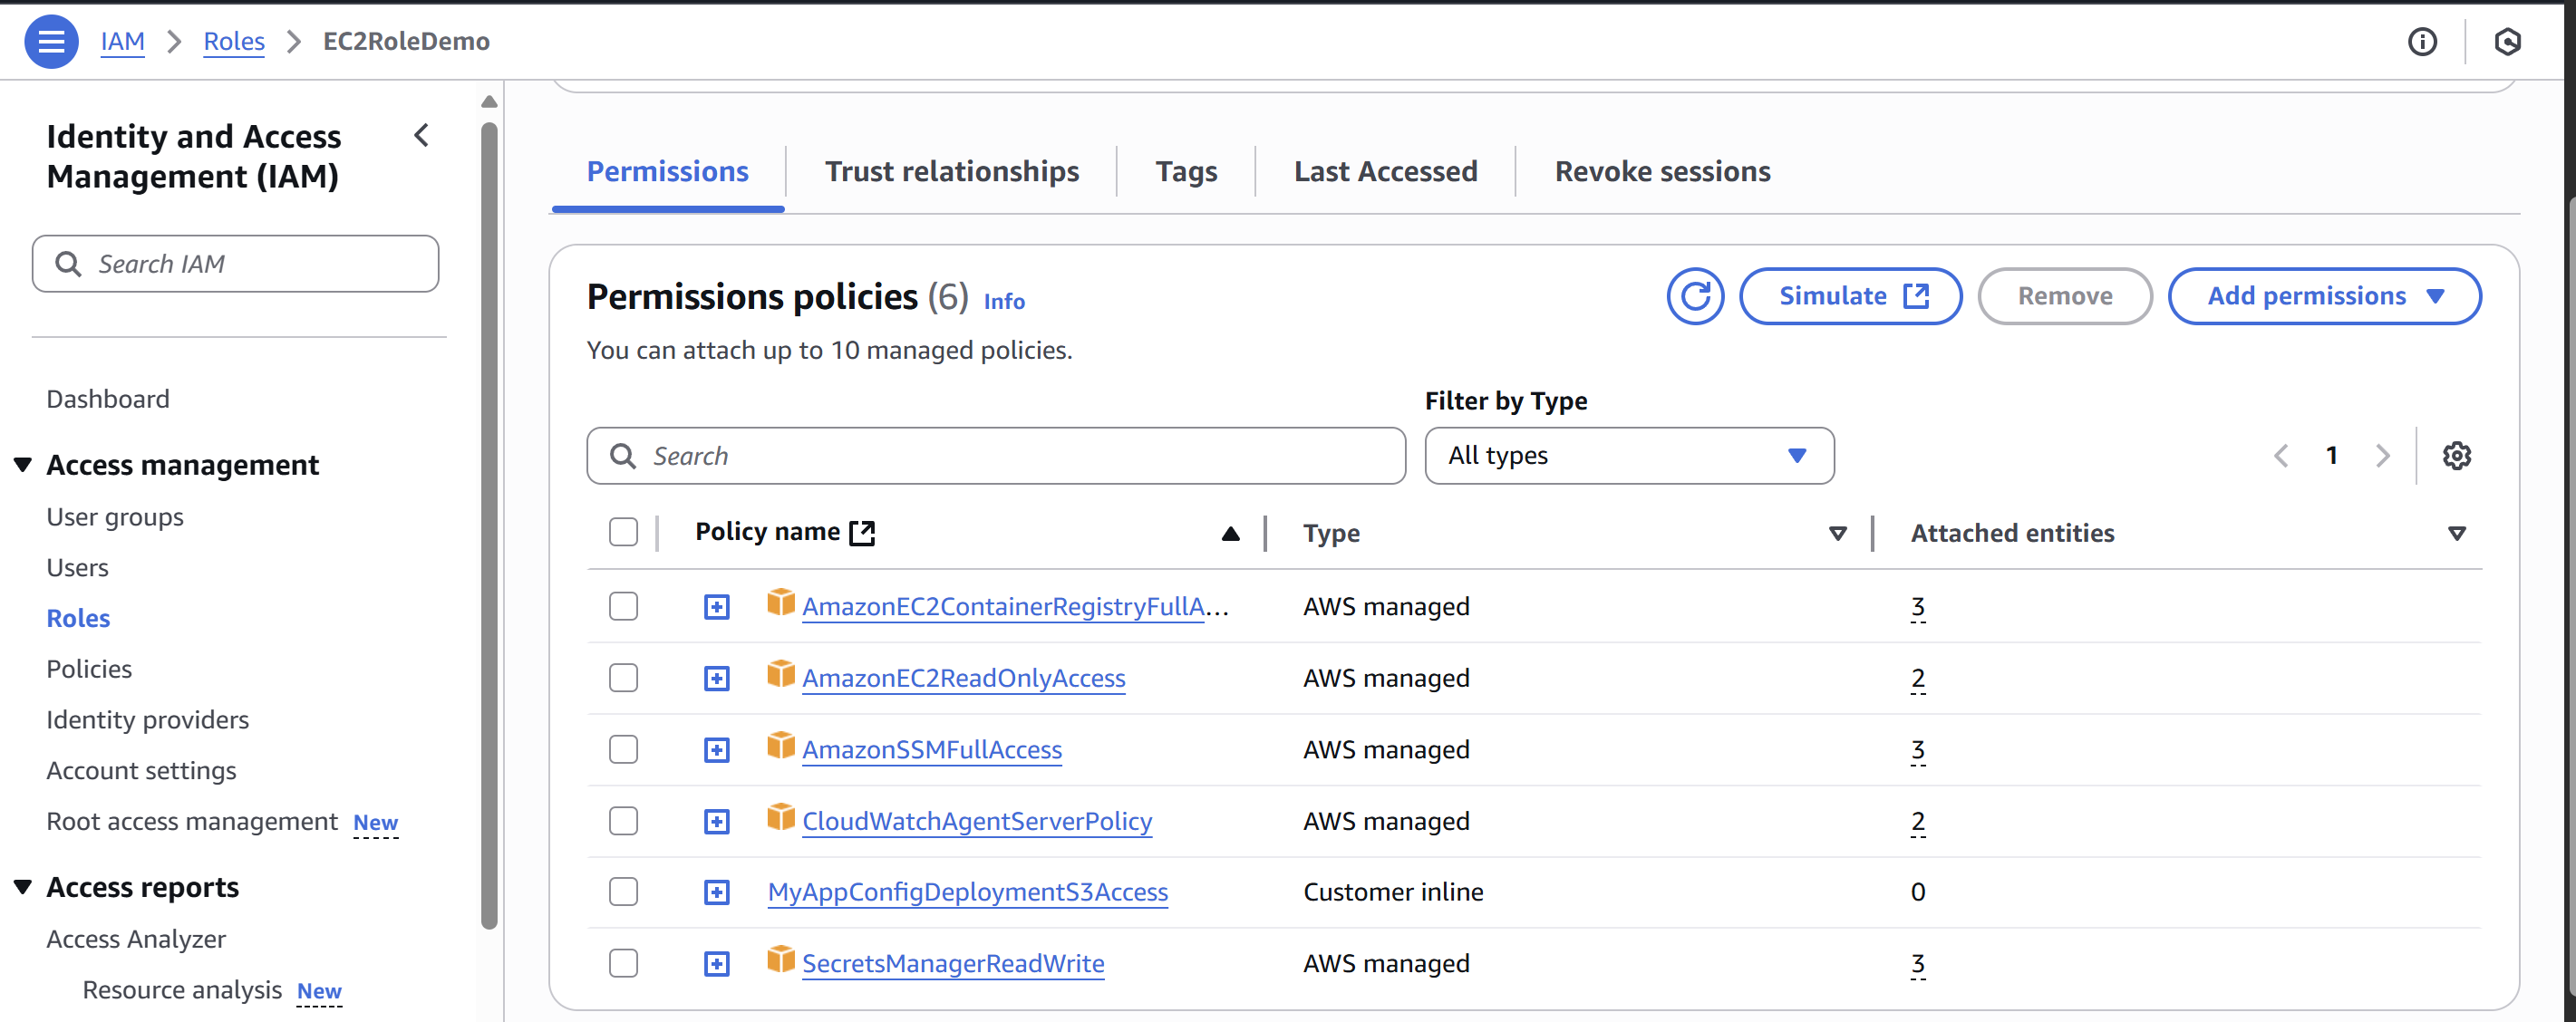
1. Update IAM Role with new permission
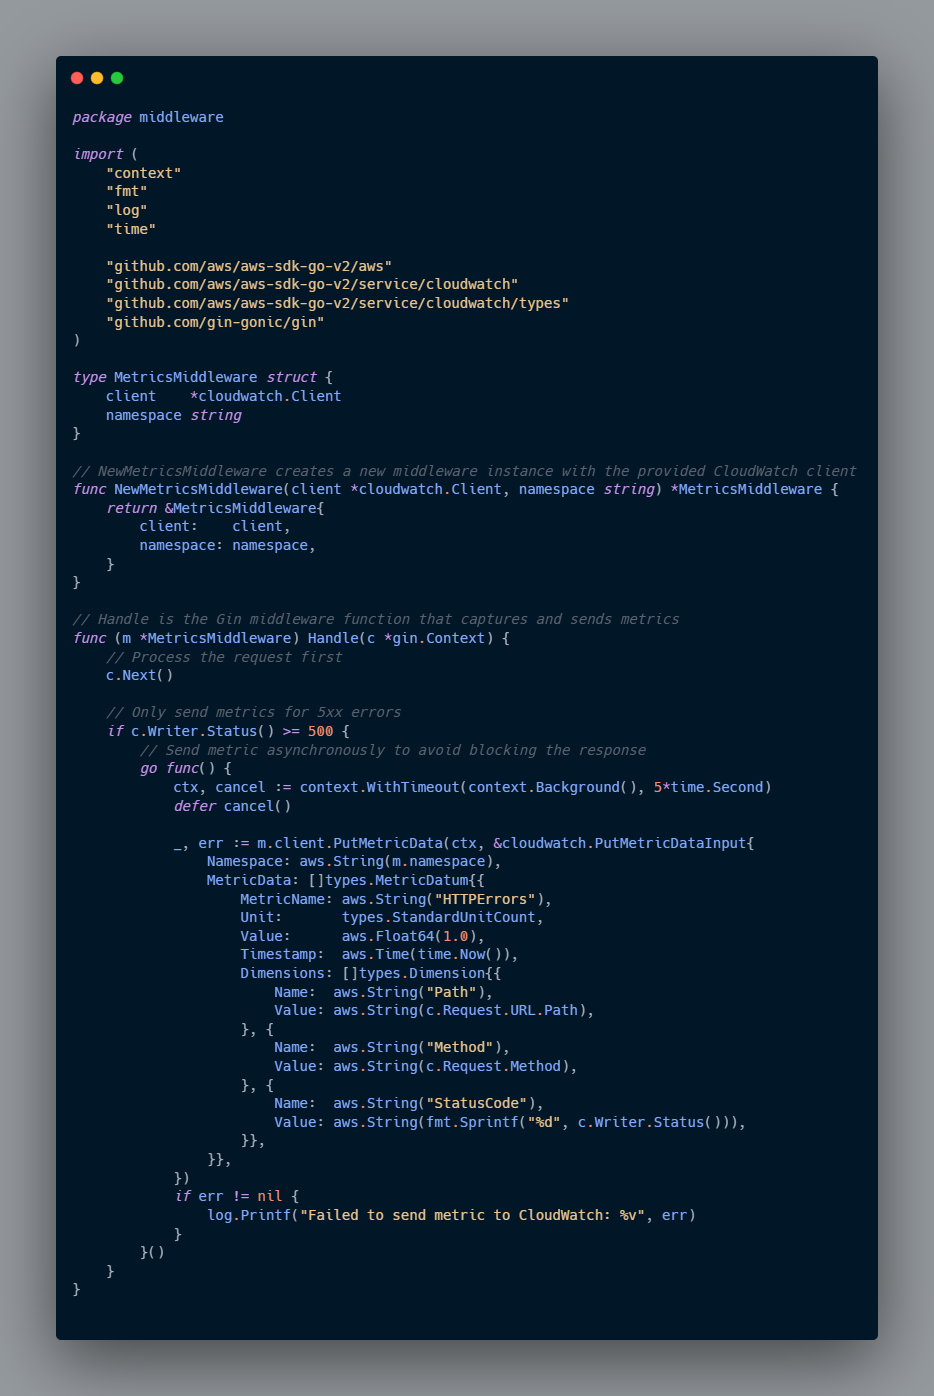
2. Go Application Setup
Let's modify our Go application to send custom metrics to CloudWatch.
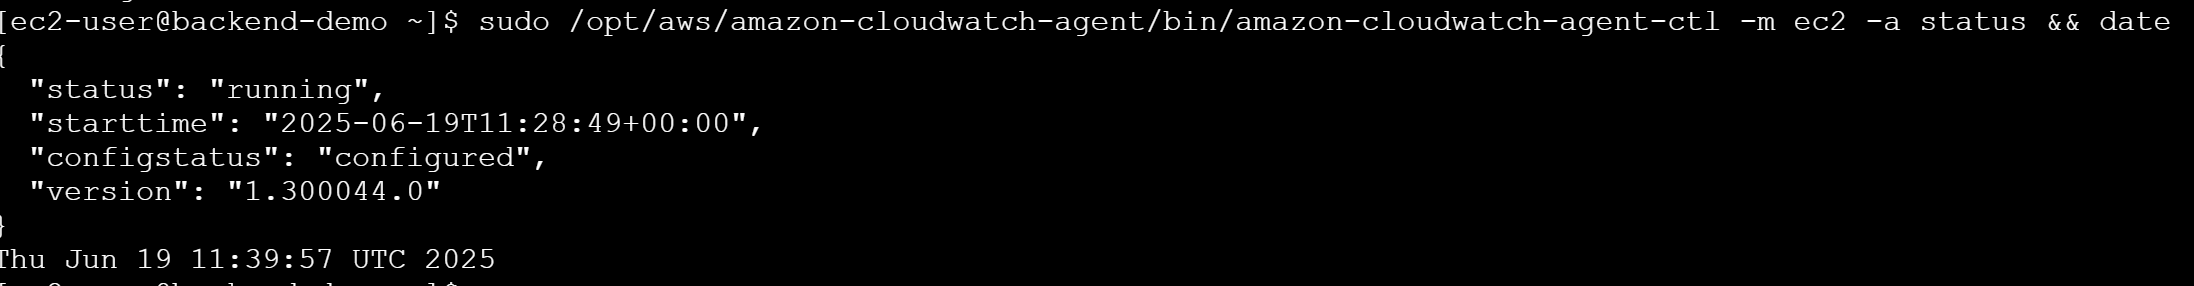
3. CloudWatch Agent Setup
Monitoring The Metrics
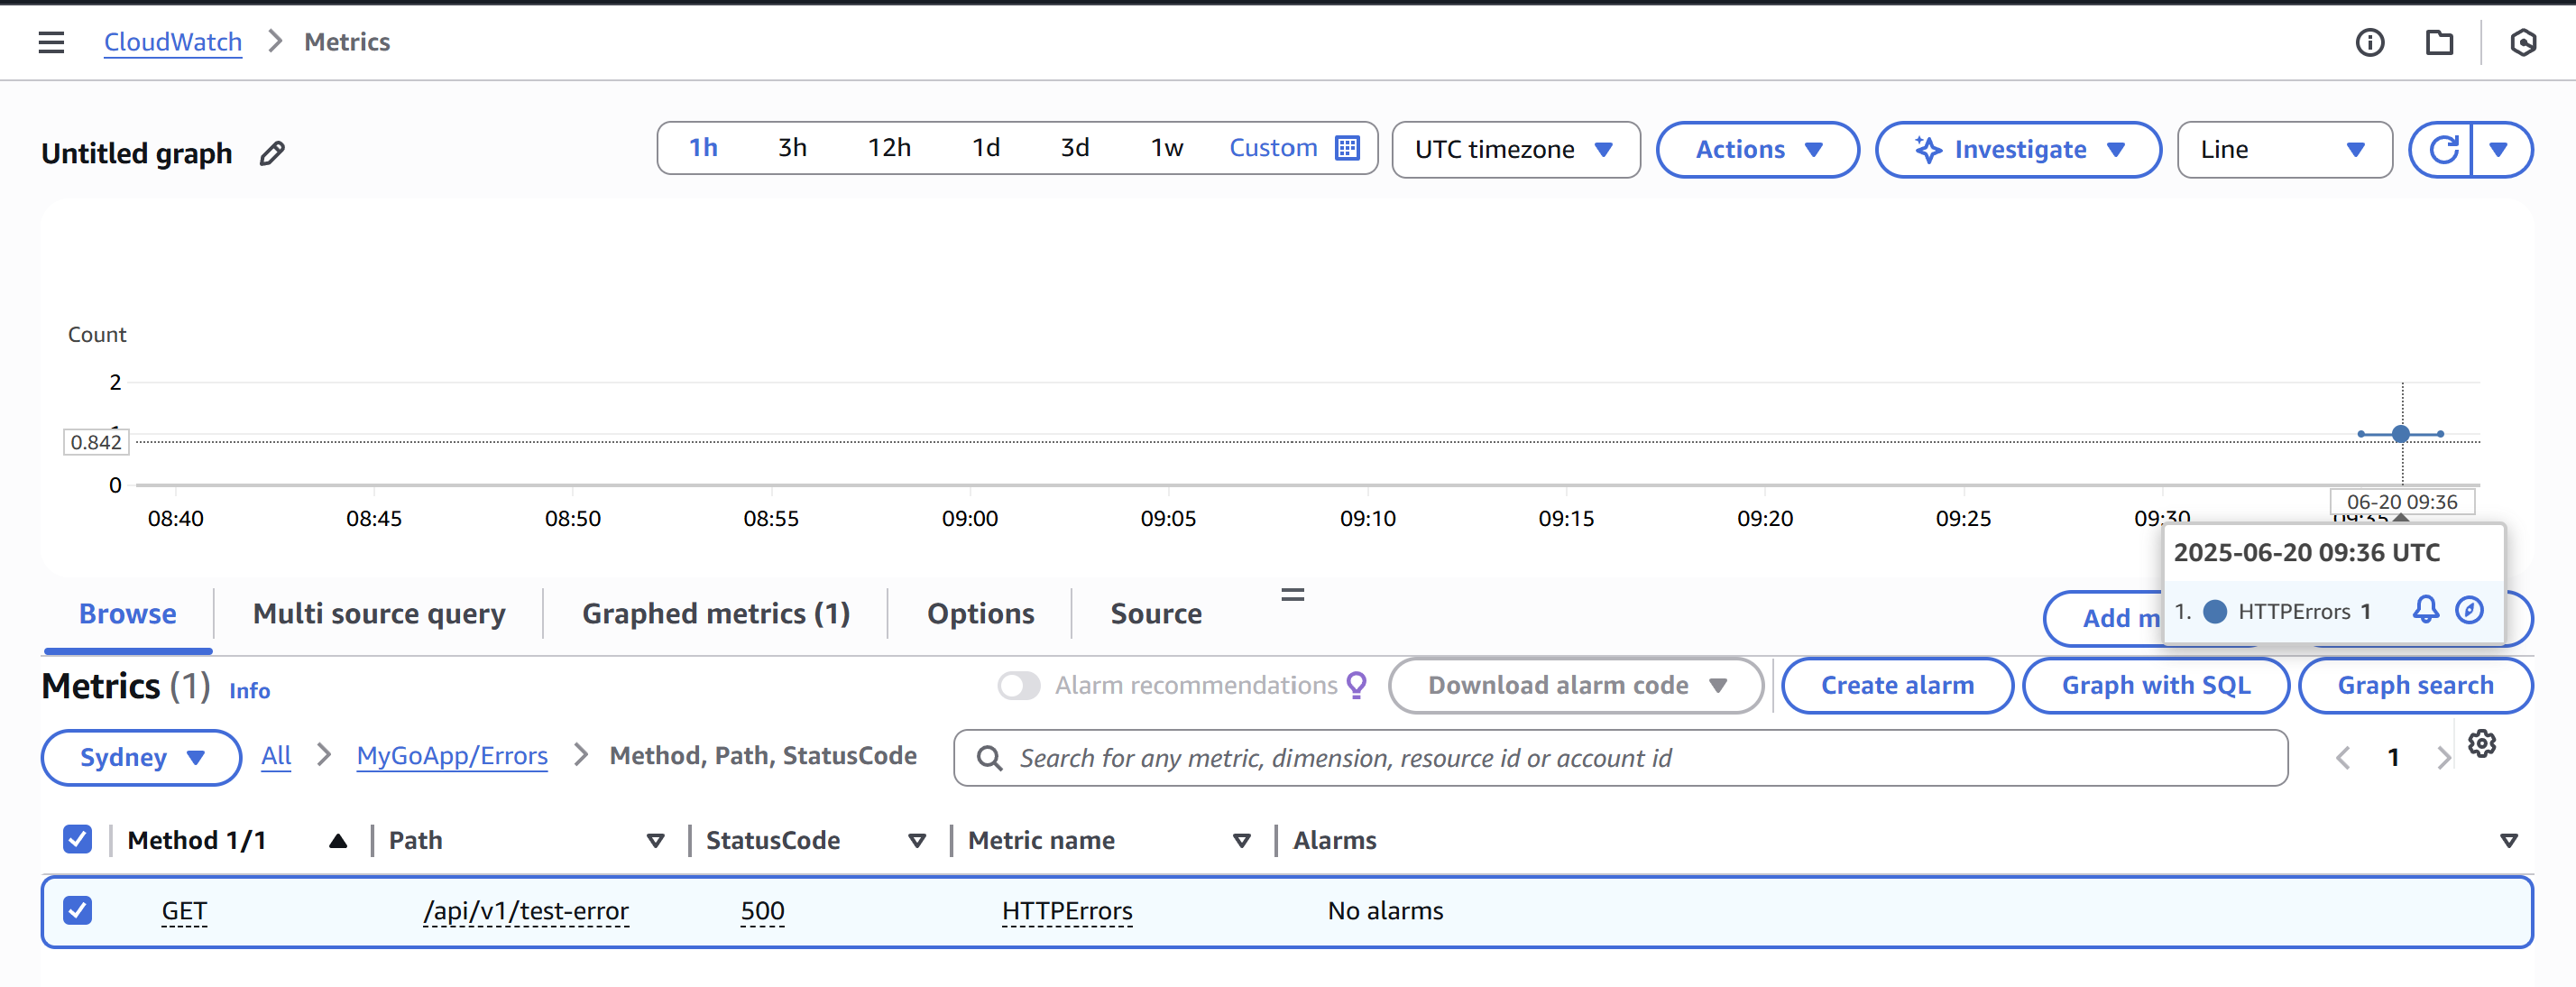
1. Monitoring Application Metrics
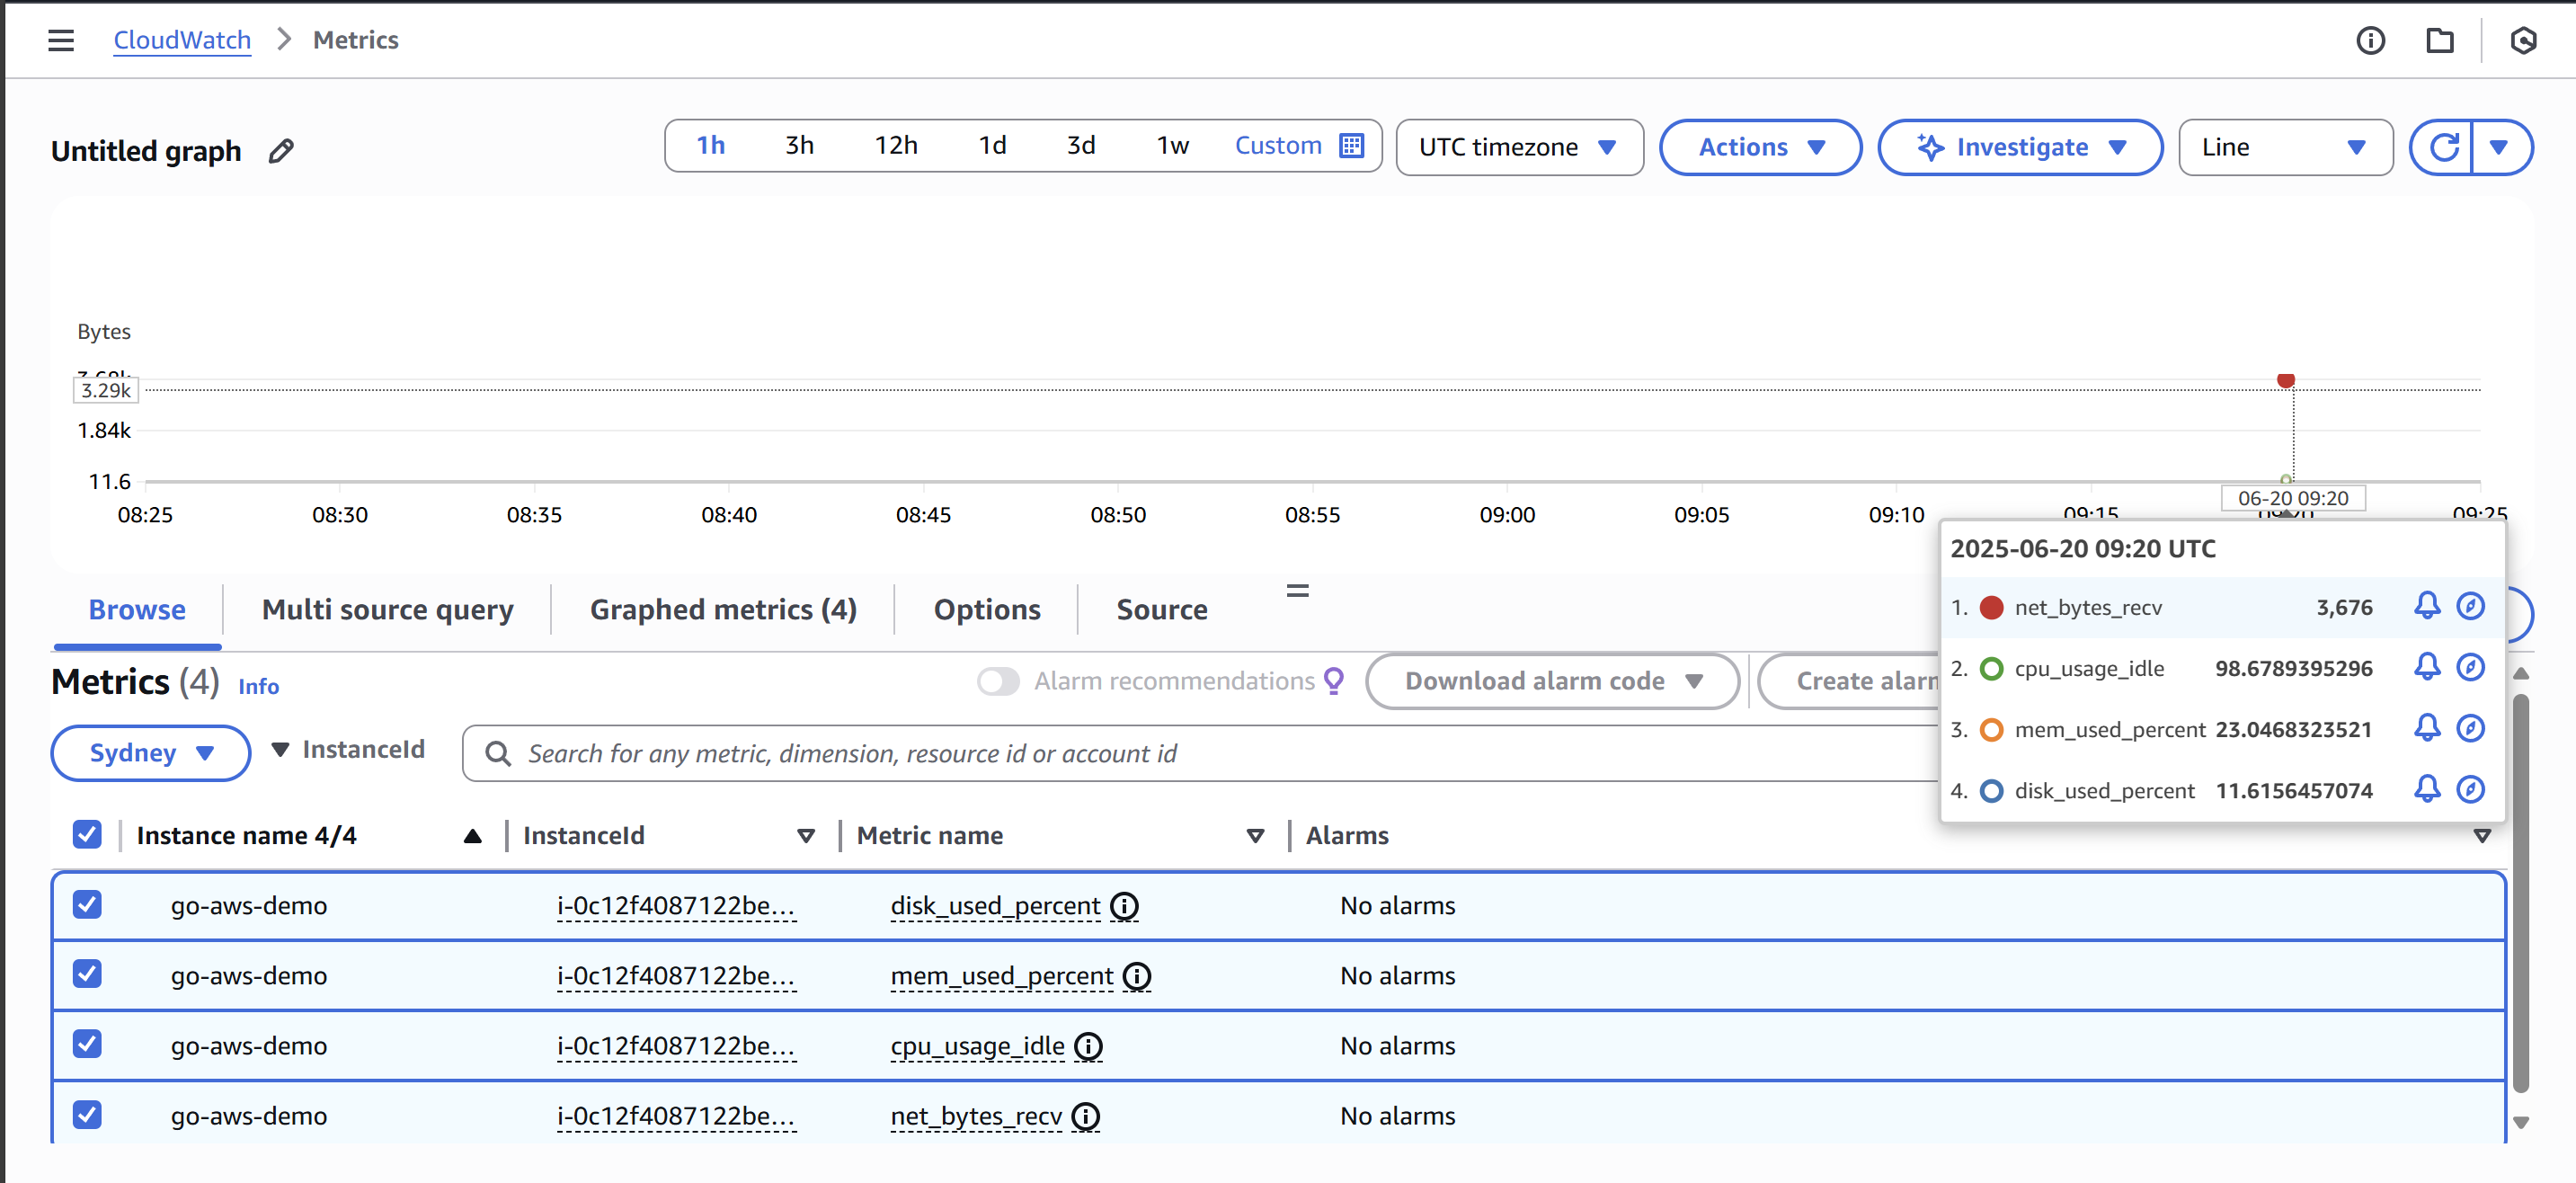
2. Monitoring EC2 Metrics
Learning Journey Highlights
CloudWatch Agent Setup
- Successfully installed CloudWatch agent
- Configured agent with custom metrics collection
- Verified agent status and metrics flow
Metrics Configuration
- Set up system metrics monitoring (CPU, Memory, Disk)
- Configured custom dimensions for better metrics organization
Resources
Next Steps
- Setting up CloudWatch Alarms for proactive monitoring
- Implementing log aggregation with CloudWatch Logs
- Integrating with SNS for notifications