AWS Journey: CloudWatch Alarms and Logs
After setting up basic CloudWatch monitoring, let's enhance our observability by implementing CloudWatch Alarms and Logs. This post will cover:
- Setting up CloudWatch Alarms for metrics
- Configuring CloudWatch Logs for log aggregation
- Creating log-based metrics and alarms
🎓 Learning Journey Note
This post documents my personal exploration of AWS CloudWatch. In this journey, I've learned how to set up CloudWatch Alarms and Logs for proactive monitoring and log aggregation. While these configurations work for learning purposes, they may not represent production-ready best practices.
📝 Step-by-Step Guide
📬 Setting Up SNS Notifications
Before creating CloudWatch Alarms, we need to set up an SNS topic to handle notifications. This will allow CloudWatch to send email alerts when alarms trigger.
1️⃣ Create an SNS Topic
- Navigate to AWS SNS Console
- Select "Topics" → "Create topic"
- Choose Standard type
- Name: "cloudwatch-alarms"
- Click "Create topic"
 create topic sns
2️⃣ Add Email Subscription
- Navigate to AWS SNS Console
- Select "Subscriptions" → "Create subscription"
- Select topic that we created earlier
- Select Email as Protocol
- Endpoint: your@email.com
- Click "Create subscription"
 create subscribe sns
 - Check email and confirm subscription
 confirm subscribe sns
Now that we have our notification system ready, let's proceed with creating CloudWatch Alarms.
🔔 Setting Up CloudWatch Alarms
Let's create alarms for both custom and system metrics:
CPU Usage Alarm (System Metric)
1️⃣ Specify metric and conditions:
- Navigate to "Alarms" in CloudWatch
- Select your application's namespace, for example, "CWAgent"
- Choose the metric you want to monitor, for example, "mem_used_percent"
- Choose "Average" in Statistic
- Set "1 minute" in Period
- Set "Static" as threshold type
- Set "Greater/Equal" as alarm condition's value
- Set threshold value to 20
- Click Next
 system metric condition
2️⃣ Configure actions:
- Set "In alarm" as state trigger
- Select an existing SNS topic
- Choose SNS topic we created earlier
- Click Next
 system metric action
3️⃣ Add alarm details
- Alarm name: "MEM-USAGE"
 system metric detail
4️⃣ Preview and create
- Click "Create alarm"
HTTP Error Rate Alarm (Custom Metric)
1️⃣ Specify metric and conditions:
- Navigate to "Alarms" in CloudWatch
- Select your application's namespace, for example, "MyGoApp/Errors"
- Choose the metric you want to monitor by metric name, status code, or whatever. For example, we want to check every error 500.
- Choose "Sum" in Statistic
- Set "1 minute" in Period
- Set "Static" as threshold type
- Set "Greater/Equal" as alarm condition's value
- Set threshold value to 5
- Click Next
 custom metric condition
2️⃣ Configure actions:
- Set "In alarm" as state trigger
- Select an existing SNS topic
- Choose SNS topic we created earlier
- Click Next
 custom metric action
3️⃣ Add alarm details
- Alarm name: "HTTP-ERROR"
 custom metric detail
4️⃣ Preview and create
- Click "Create alarm"
📧 CloudWatch Alarm Notifications
When your configured alarms trigger, you'll receive email notifications like this:
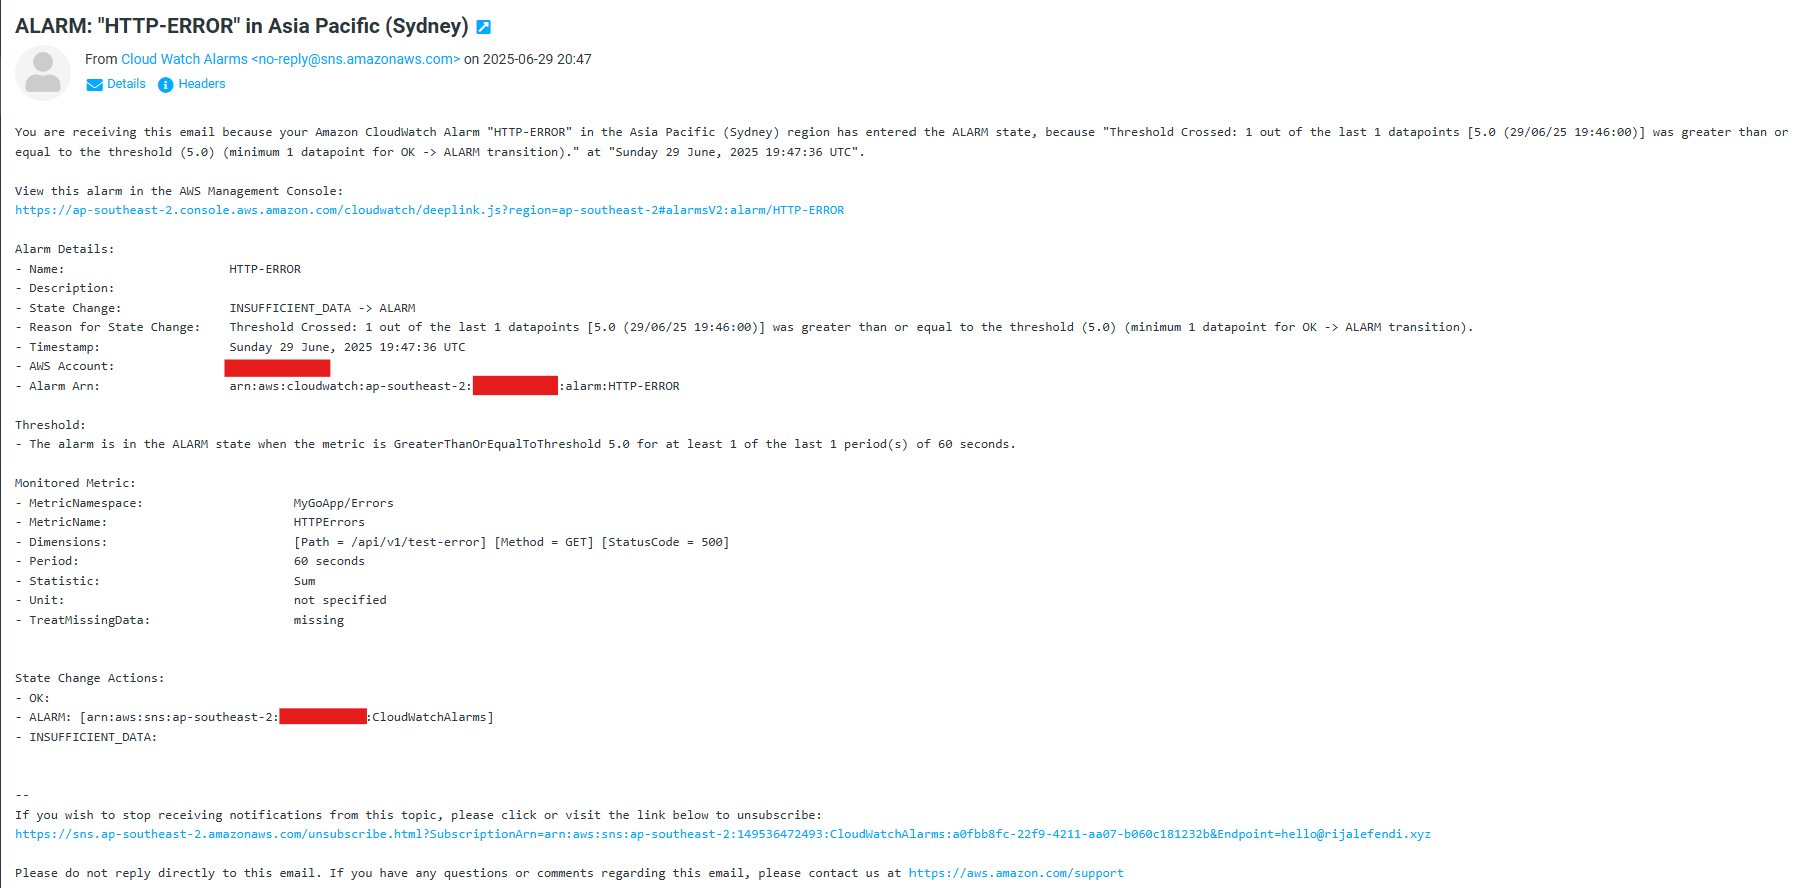 custom metric email notification example
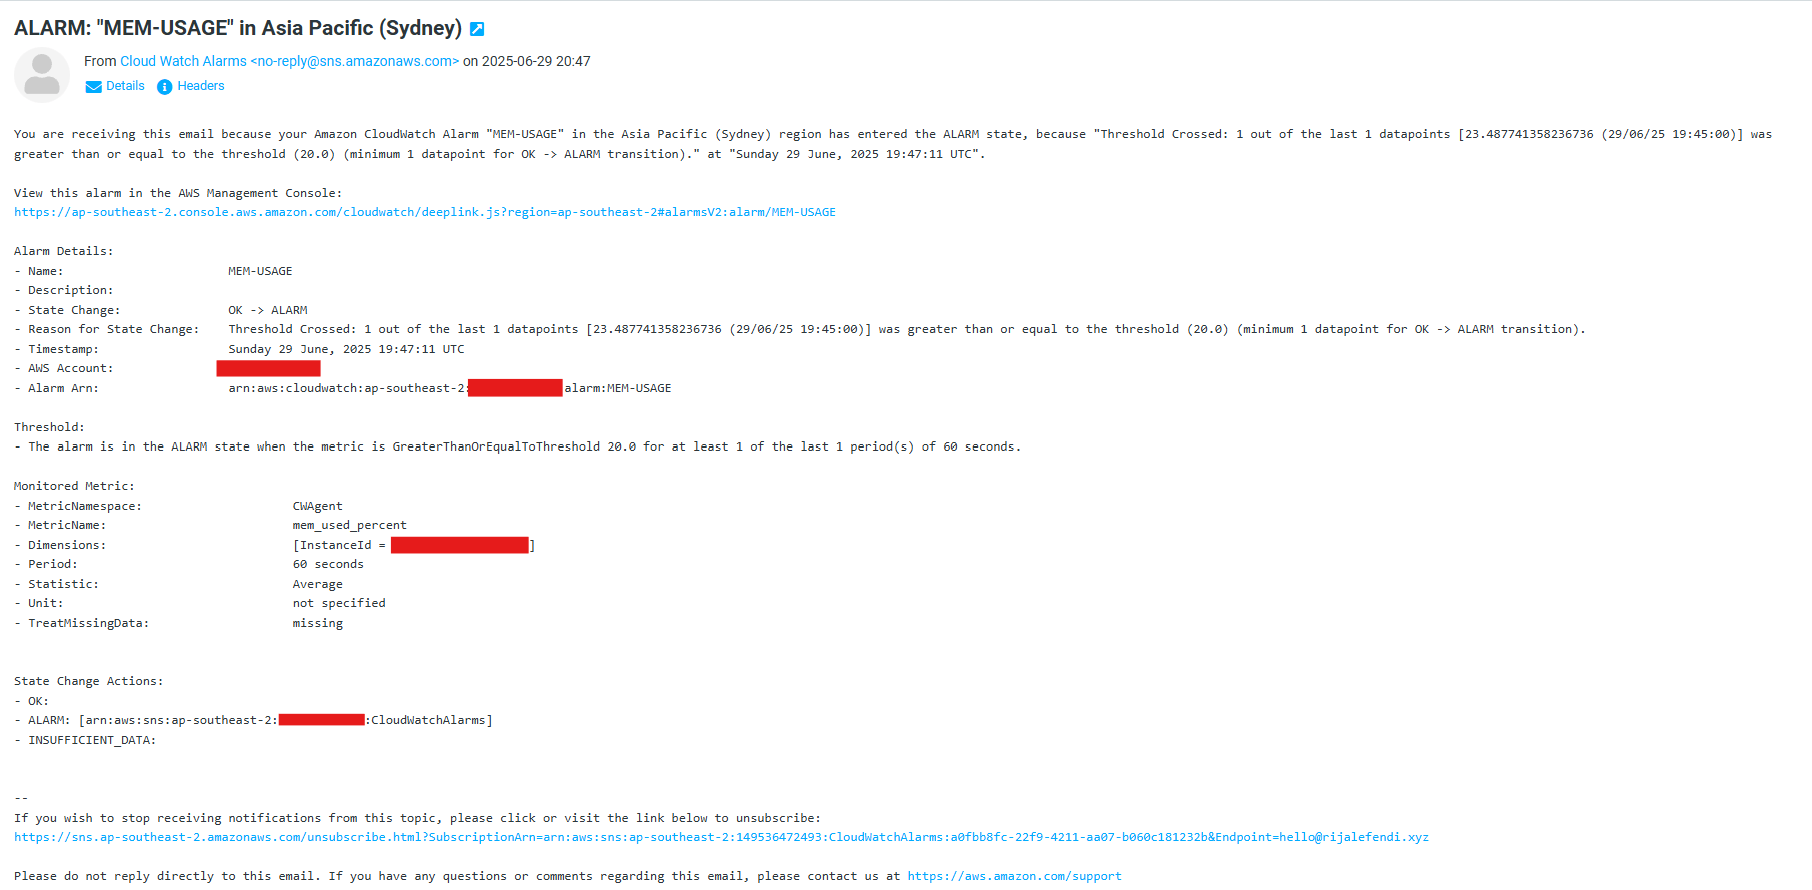 system metric email notification example
🔍 Setting Up CloudWatch Logs
1️⃣ Update docker compose
services:
  go:
    logging:
    driver: "awslogs"
    options:
      awslogs-region: "${AWS_REGION}"
      awslogs-group: "/app/go"
      awslogs-stream: "${LOG_STREAM_NAME_APP}"
      awslogs-create-group: "true"
- awslogs-group: The log group name in CloudWatch Logs.
- awslogs-stream: The log stream name within the log group. We use a date-based naming pattern to organize logs chronologically, making it easier to find logs from specific time periods and automatically rotate streams.
- awslogs-create-group: If set to "true", CloudWatch Logs will automatically create the log group if it doesn't exist.
2️⃣ Add log stream environment variable inside GitLab CI/CD deploy job
"export LOG_STREAM_NAME_APP=go-$(date +%Y-%m-%d-%H)",
"export LOG_STREAM_NAME_DB=mysql-$(date +%Y-%m-%d-%H)",
"DB_HOST=${DB_HOST} DB_USER=${DB_USER} DB_PORT=${DB_PORT} DB_PASSWORD=${DB_PASSWORD} DB_ROOT_PASSWORD=${DB_ROOT_PASSWORD} DB_NAME=${DB_NAME} PORT=${PORT} GIN_MODE=${GIN_MODE} ECR_REPOSITORY_URL=${ECR_REPOSITORY_URL} IMAGE_TAG=${IMAGE_TAG} LOG_STREAM_NAME_APP=${LOG_STREAM_NAME_APP} LOG_STREAM_NAME_DB=${LOG_STREAM_NAME_DB} docker-compose -f docker-compose.prod.yml up -d go",
🤩 Implementing Structured Logging
Let's create reusable logging components to standardize our application's logging format and ensure consistent log collection in CloudWatch:
1️⃣ Create Logging Utility
package utils

import (
  "encoding/json"
  "fmt"
  "time"
)

type LogEntry struct {
  Timestamp  string  `json:"timestamp"`
  Level      string  `json:"level"`
  Message    string  `json:"message"`
  RequestID  string  `json:"request_id,omitempty"`
  Method     string  `json:"method,omitempty"`
  Path       string  `json:"path,omitempty"`
  StatusCode int     `json:"status_code,omitempty"`
  LatencyMS  float64 `json:"latency_ms,omitempty"`
  ClientIP   string  `json:"client_ip,omitempty"`
}

func LogJSON(level, message string, fields map[string]interface{}) {
  entry := LogEntry{
    Timestamp: time.Now().UTC().Format(time.RFC3339),
    Level:     level,
    Message:   message,
  }

  // Add additional fields
  for k, v := range fields {
    switch k {
    case "request_id":
      entry.RequestID = fmt.Sprint(v)
    case "method":
      entry.Method = fmt.Sprint(v)
    case "path":
      entry.Path = fmt.Sprint(v)
    case "status_code":
      if code, ok := v.(int); ok {
        entry.StatusCode = code
      }
    case "latency_ms":
      if latency, ok := v.(float64); ok {
        entry.LatencyMS = latency

      }
    case "client_ip":
      entry.ClientIP = fmt.Sprint(v)
    }
  }

  jsonLog, _ := json.Marshal(entry)

  fmt.Println(string(jsonLog))
}
2️⃣ Create Logging Middleware
package middleware

import (
  "time"

  "github.com/gin-gonic/gin"
  "github.com/google/uuid"
  "gitlab.com/rijalefendi94/go-aws-demo/internal/pkg/utils"
)

func LoggingMiddleware() gin.HandlerFunc {
  return func(c *gin.Context) {
    start := time.Now()
    requestID := uuid.New().String()
    c.Set("request_id", requestID)

    c.Next()

    // Calculate request duration
    duration := float64(time.Since(start).Milliseconds())
    statusCode := c.Writer.Status()

    // Prepare log fields
    logFields := map[string]interface{}{
      "request_id":  requestID,
      "method":      c.Request.Method,
      "path":        c.Request.URL.Path,
      "status_code": statusCode,
      "latency_ms":  duration,
      "client_ip":   c.ClientIP(),
      "user_agent":  c.Request.UserAgent(),
    }

    // Determine log level and message
    logLevel := "info"
    logMessage := "Request processed"

    // Handle errors and set appropriate log level
    if len(c.Errors) > 0 {
      logLevel = "error"
      logMessage = c.Errors.String()
    } else if statusCode >= 500 {
      logLevel = "error"
      logMessage = "Internal server error"
    } else if statusCode >= 400 {
      logLevel = "warn"
      logMessage = "Request failed"
    }

    // Single log call with appropriate level and message
    utils.LogJSON(logLevel, logMessage, logFields)
  }
}
3️⃣ Register the middleware
func main() {
  router := gin.Default()
  router.Use(middleware.LoggingMiddleware())

  // ... rest of your routes
}
🔎 Analyzing Logs with CloudWatch Logs Insights
CloudWatch Logs Insights enables you to search and analyze your log data efficiently. Let's explore how to query our structured logs:
1️⃣ Navigate to CloudWatch Logs Insights
- Go to CloudWatch console
- Select "Logs Insights" from the left navigation
- Set time range, e.g., "1h"
- Choose your log group (e.g., "/app/go")
2️⃣ Querying Structured Logs
- Use the query editor to write your search query
- Example:
  parse @message '"level":"*"' as level

  | parse @message '"path":"*"' as path

  | parse @message '"status_code":*,' as status_code

  | filter level = "error"

  | fields @timestamp, @message

  | sort @timestamp desc

  | limit 20
3️⃣ Interpreting Query
- parse @message '"level":"*"' as level - Extracts the level field from the JSON structure. In CloudWatch, the entire JSON object is stored as a string in the @message field, so we need to use parse to extract specific fields.
- parse @message '"path":"*"' as path - Extracts the request path from the nested JSON. The pattern matches the JSON key-value format with quotes around both the key and string value.
- parse @message '"status_code":*,' as status_code - Extracts the HTTP status code from the JSON. Note that we don't include quotes in the pattern since status_code is a numeric value in the JSON.
- filter level = "error" - Only shows logs with error level
- fields @timestamp, @message - Displays only timestamp and full message
- sort @timestamp desc - Shows newest logs first
- limit 20 - Returns only 20 results
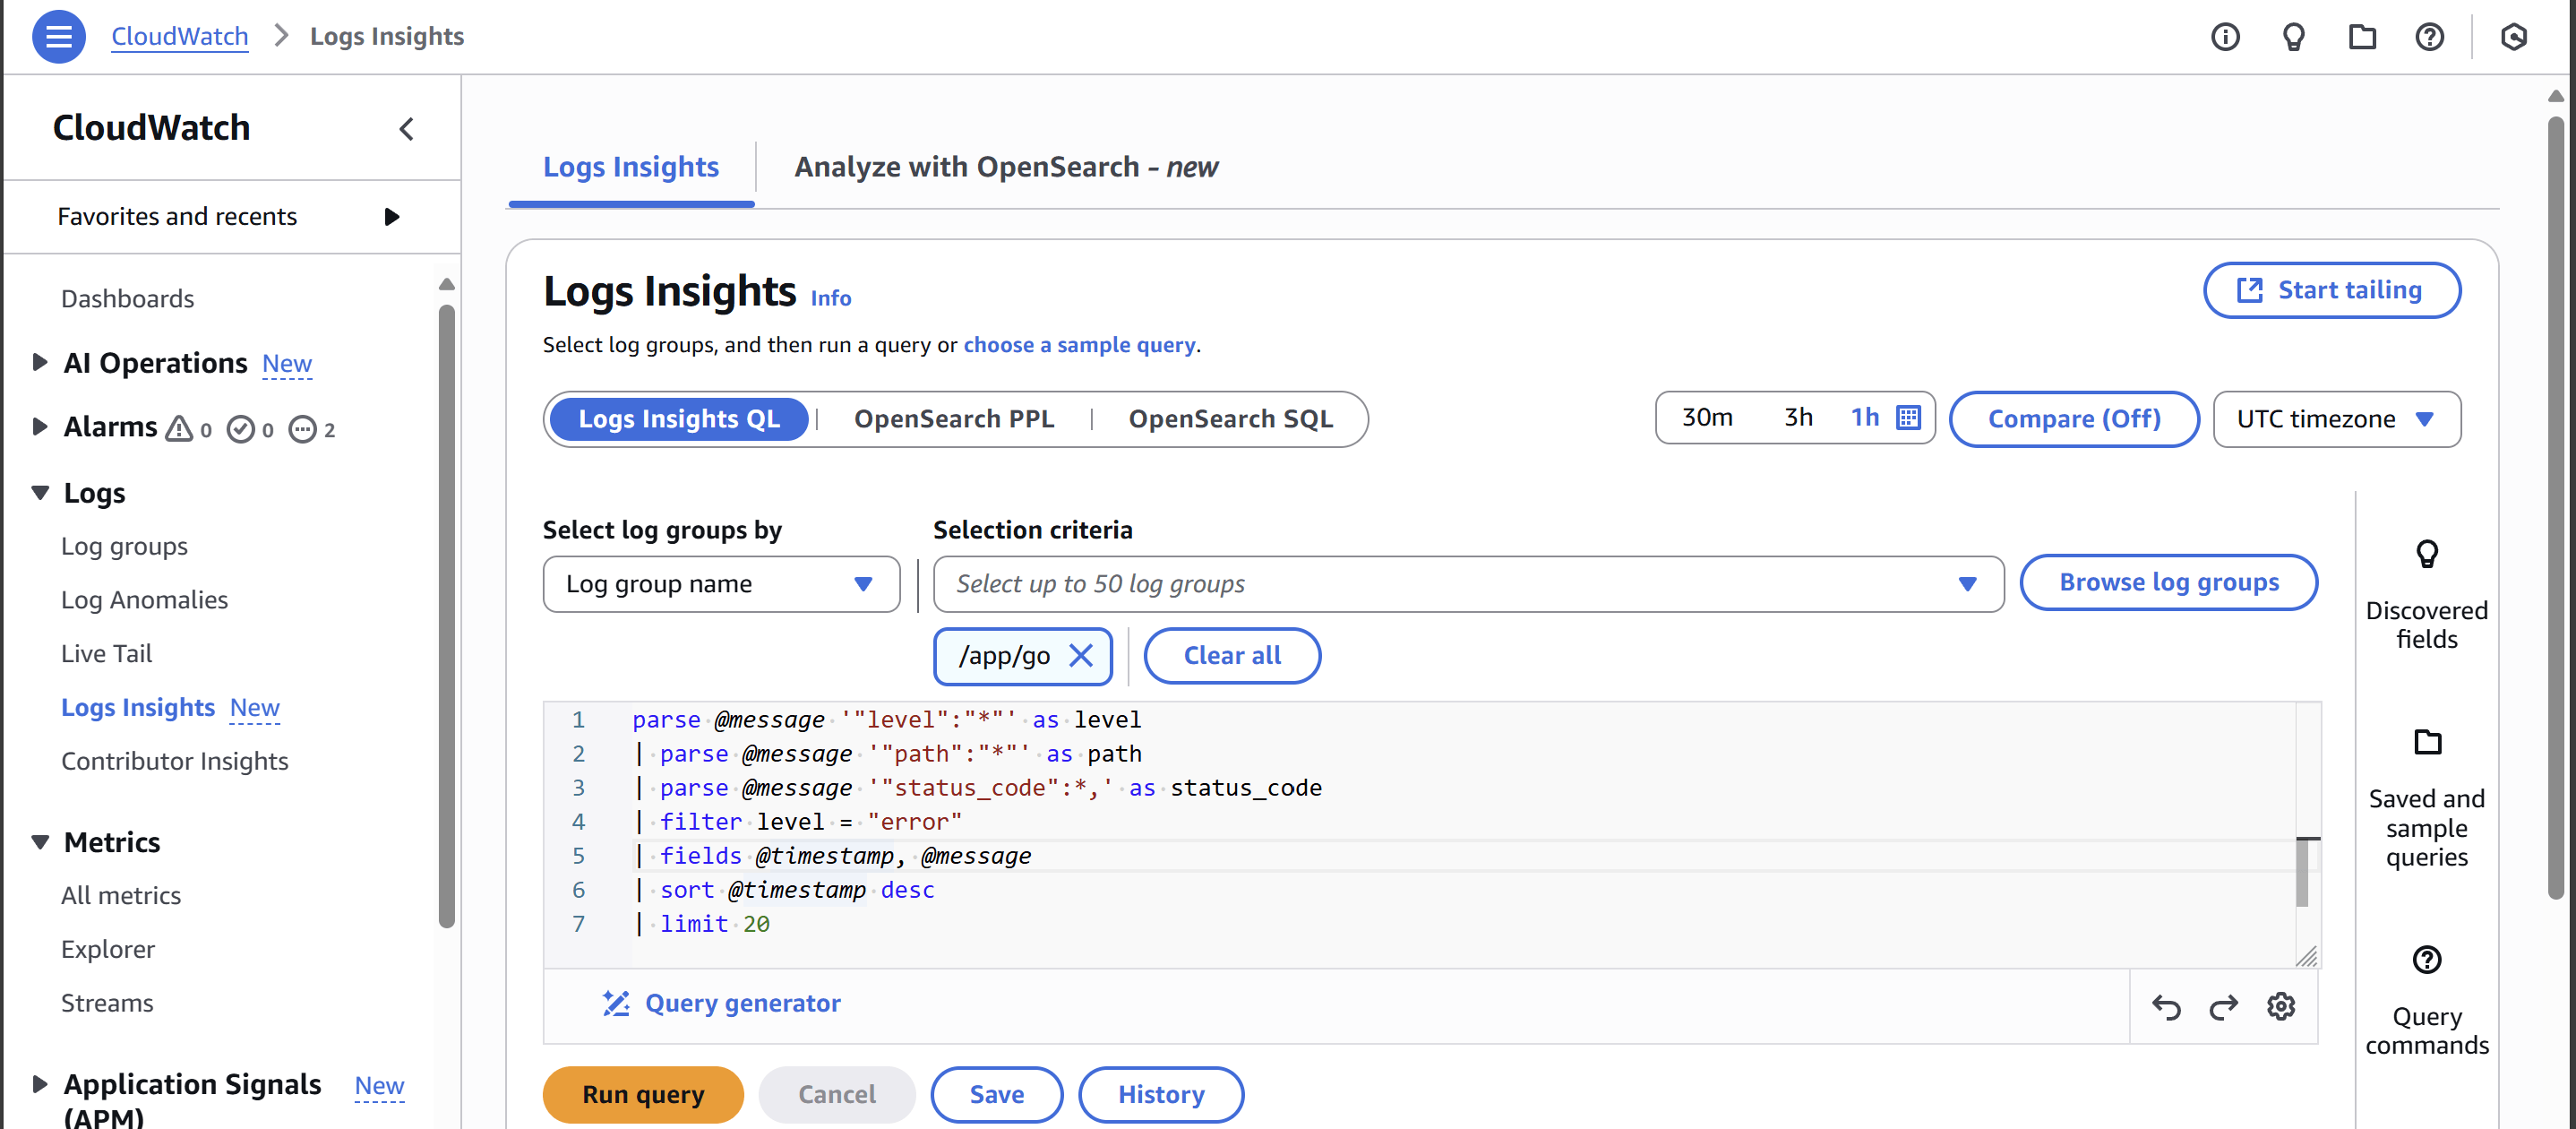 cloudwatch log insight example
- Click "Run Query" to see the results
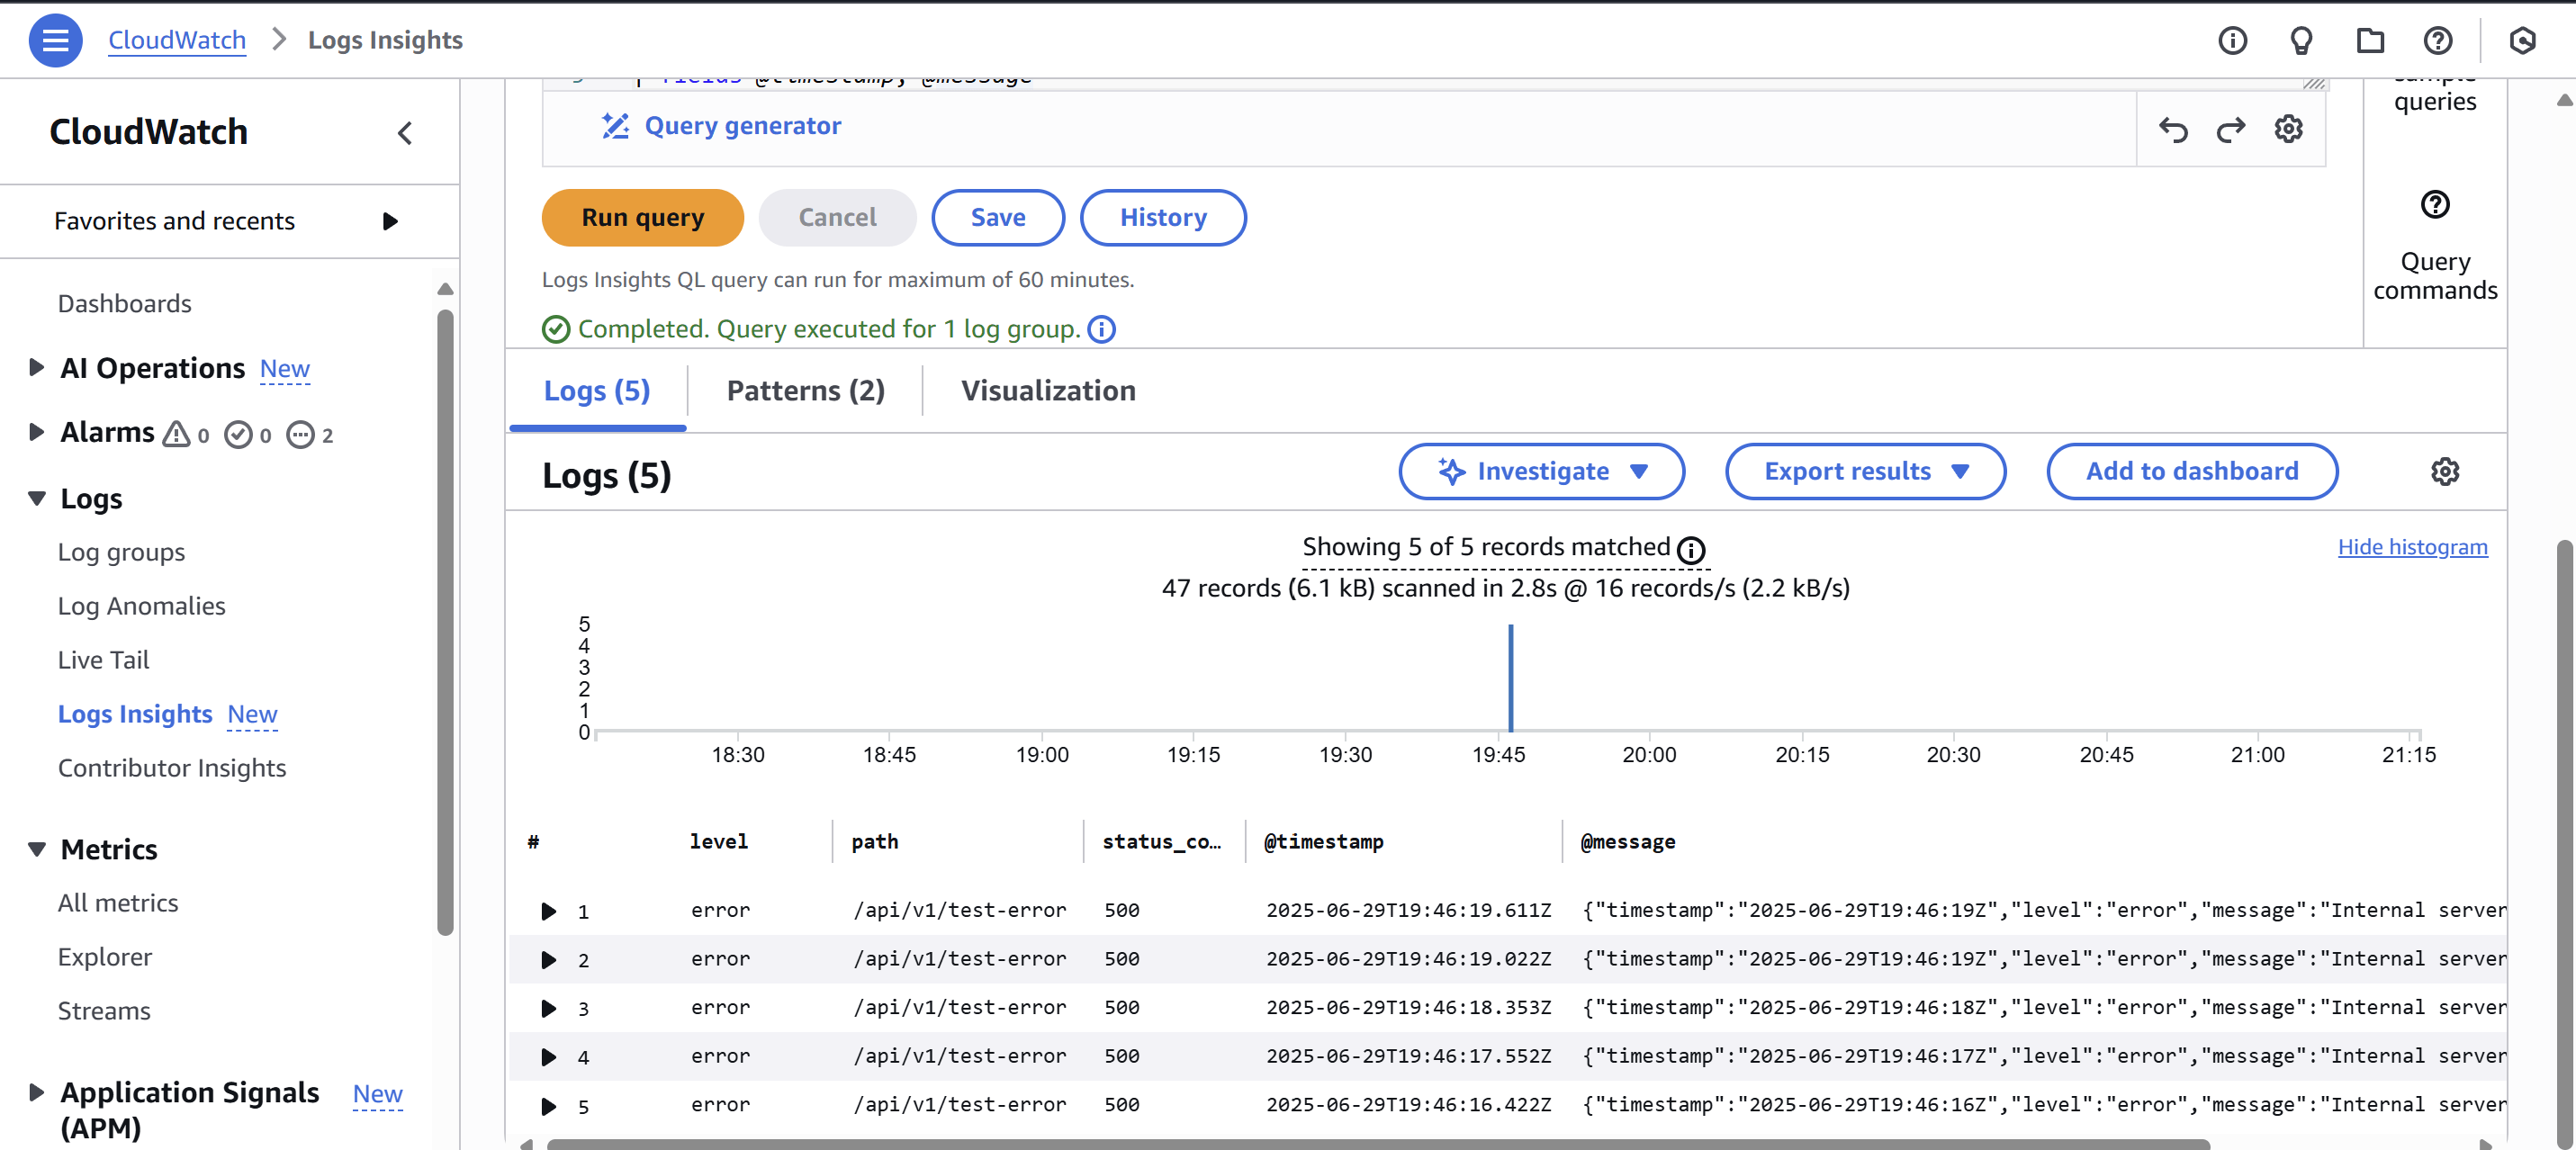 result query example
🌟 Learning Journey Highlights
✅ Alarm Configuration
- Set up CloudWatch Alarms for metrics
- Configured thresholds and conditions
- Utilized SNS notifications for timely alerts
✅ Log Management
- Mastered CloudWatch Logs configuration
- Implemented structured logging patterns
- Created custom log groups and streams
🔗 Resources
Demo Repository
Full repository with complete implementation can be found here