AWS Journey: Monitoring with CloudWatch
After setting up S3 in our CI/CD pipeline, the next step is implementing proper monitoring. In this post, we'll explore AWS CloudWatch to monitor our Go application's health and performance. We'll focus on two key aspects:
- Custom metrics from our Go application (error tracking)
- System-level metrics (CPU, memory, network, disk)
Why CloudWatch? It provides:
- Centralized monitoring
- Custom metrics for application-specific data
- System-level metrics for infrastructure health
- Integration with other AWS services
📝 Step-by-Step Guide
1. Update IAM Role with new permission
First, we need to update our EC2 instance's IAM role to allow CloudWatch access:
- Access AWS Console > IAM > Roles
- Click our existing IAM Role that we've been using so far EC2RoleDemo
- Click "Add Permissions" > "Attach policies" > Search "CloudWatchAgentServerPolicy" > Add permissions
- This policy will allow the CloudWatch agent to collect system metrics and send them to CloudWatch
 updated iam role
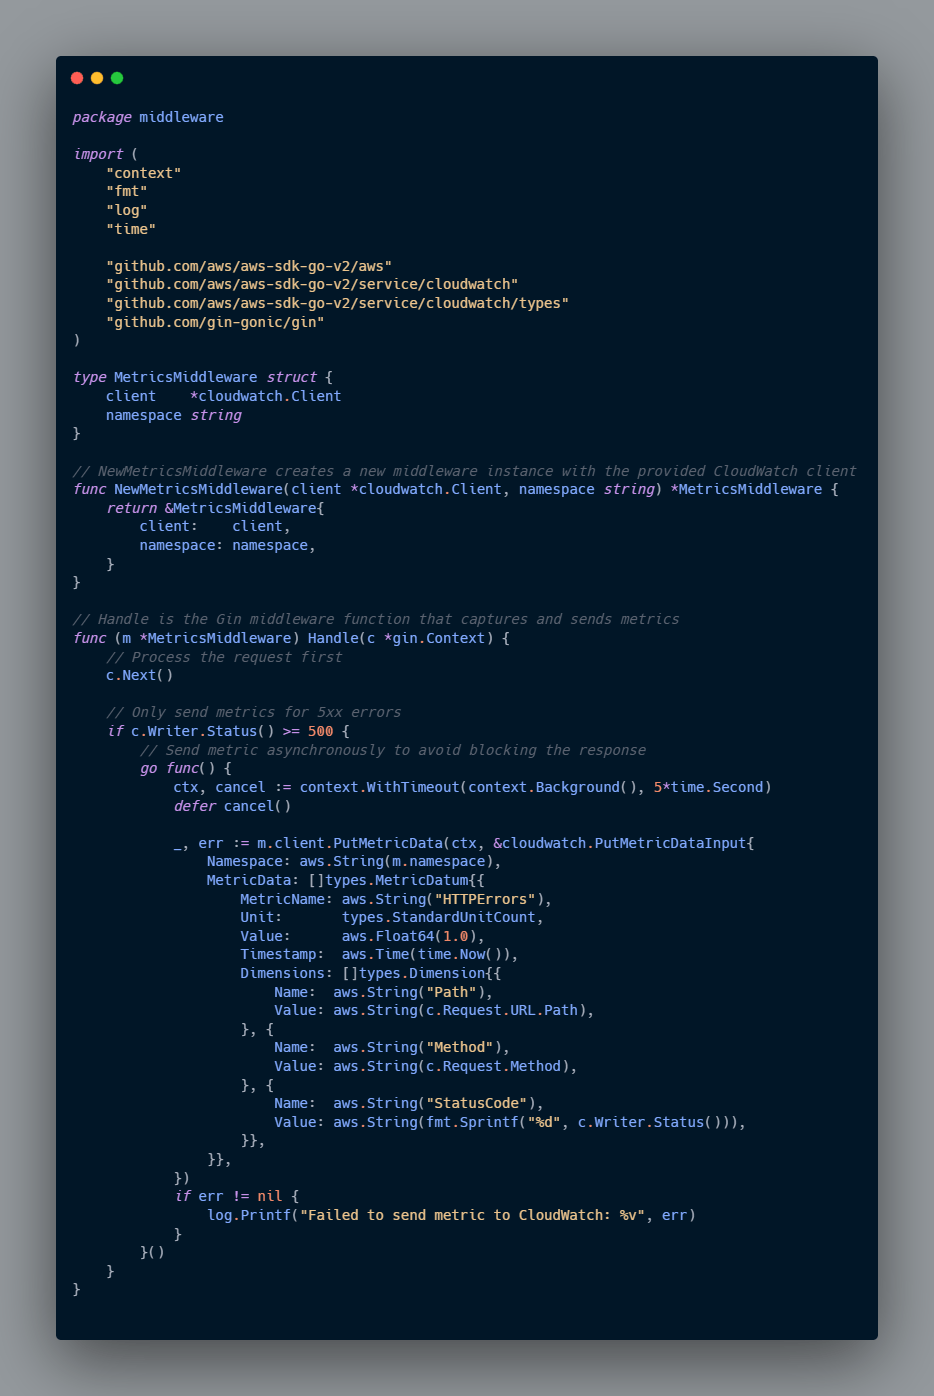
2. Go Application Setup
Let's modify our Go application to send custom metrics to CloudWatch:
Install AWS SDK Dependencies
go get github.com/aws/aws-sdk-go-v2
go get github.com/aws/aws-sdk-go-v2/config
go get github.com/aws/aws-sdk-go-v2/service/cloudwatch
Use CloudWatch Client in main function
func main() {
// the existing code
// Initialize CloudWatch client once
  cfg, err := config.LoadDefaultConfig(context.TODO(), config.WithRegion("ap-southeast-1"))
  if err != nil {
  	log.Fatalf("Failed to load AWS config, %v", err)
  }
  client := cloudwatch.NewFromConfig(cfg)
  metricsMiddleware := middleware.NewMetricsMiddleware(client, "MyGoApp/Errors")

  router.Use(metricsMiddleware.Handle)
// the existing code
}
Add new endpoint in main function to simulate error 500
  api.GET("/test-error", func(c *gin.Context) {
  		c.JSON(500, gin.H{
  			"code":  500,
  			"error": "Internal server error",
  		})
  	})
3. CloudWatch Agent Setup
- Install AWS Agent
sudo yum install amazon-cloudwatch-agent
- Create a configuration file
sudo touch /opt/aws/amazon-cloudwatch-agent/bin/config.json
- Setting up configuration file for basic system metrics
sudo vi /opt/aws/amazon-cloudwatch-agent/bin/config.json
- Add this config below to the file
{
  "agent": {
    "metrics_collection_interval": 60,
    "run_as_user": "root"
  },
  "namespace": "EC2/System",
  "metrics": {
    "aggregation_dimensions": [
      ["InstanceId"]
    ],
    "append_dimensions": {
      "InstanceId": "${aws:InstanceId}",
    },
    "metrics_collected": {
      "cpu": {
        "measurement": ["cpu_usage_idle"],
        "metrics_collection_interval": 60,
        "totalcpu": true
      },
      "mem": {
        "measurement": ["mem_used_percent"],
        "metrics_collection_interval": 60
      },
      "disk": {
        "measurement": ["used_percent"],
        "metrics_collection_interval": 60,
        "resources": ["*"]
      },
      "net": {
        "measurement": ["bytes_recv"],
        "metrics_collection_interval": 60,
        "resources": ["*"]
      }
    }
  }
}
Collected Metrics:
- CPU Utilization
- Measures idle CPU percentage
- Collects every 60 seconds
- Aggregates across all CPUs
- Memory Usage
- Tracks memory usage percentage
- Updates every 60 seconds
- Disk Usage
- Monitors disk usage percentage
- Checks all disk volumes ( "resources": ["*"] )
- Network Bytes Received
- Measures incoming network traffic
- Monitor all network interfaces
- Start the AWS Agent service
sudo /opt/aws/amazon-cloudwatch-agent/bin/amazon-cloudwatch-agent-ctl -a fetch-config -m ec2 -c file:/opt/aws/amazon-cloudwatch-agent/bin/config.json -s
- Check the status
sudo /opt/aws/amazon-cloudwatch-agent/bin/amazon-cloudwatch-agent-ctl -m ec2 -a status
 status cloudwatch agent
Monitoring The Metrics
After we already successfully installed and added proper permissions, then we can monitor those metrics on AWS CloudWatch.
1. Monitoring Application Metrics
- Navigate to "Metrics" in CloudWatch
- Select your application's namespace, for example, "MyGoApp/Errors"
- Choose the metric you want to monitor, for example, "HTTPErrors"
- Set the time range for the metrics. For example, last 1 hour.
 custom metric
2. Monitoring EC2 Metrics
- Navigate to Metrics in CloudWatch
- In All metrics, select "CWAgent" from the list of metric namespaces
- Select the specific metrics you want to monitor from the available metrics in that group
- Set the time range for the metrics. For example, last 1 hour.
 system metric
🌟 Learning Journey Highlights
✅ CloudWatch Agent Setup
- Successfully installed CloudWatch agent
- Configured agent with custom metrics collection
- Verified agent status and metrics flow
✅ Metrics Configuration
- Set up system metrics monitoring (CPU, Memory, Disk)
- Configured custom dimensions for better metrics organization
- Established proper aggregation intervals
✅ Monitoring Implementation
- Set up metric groups for efficient monitoring
- Successfully receiving and visualizing metrics data
🔗 Resources
Demo Repository
Full repository with complete implementation can be found here
Official Documentation
📈 Next Steps
Our upcoming focus areas include:
- Setting up CloudWatch Alarms for proactive monitoring
- Implementing log aggregation with CloudWatch Logs
- Integrating with SNS for notifications